Your Lender Approved You for $450,000. Your Actual Comfort Zone Might Be $320,000.
Banks calculate the maximum debt you can carry without defaulting. They do not calculate whether you can still save for retirement, take a vacation, or replace your car. That gap between approval and affordability is where first-time buyers get into serious financial trouble.
Free online calculators make it worse. Most show only principal and interest — two of the six cost components you will actually pay every month. They default to a 20% down payment you may not have, a credit score that earns the lowest advertised rate, and property tax estimates pulled from outdated municipal data. Buyers routinely discover their true monthly cost is $400 to $600 higher than the number they saw on Zillow or Bankrate.
The True Cost Calculator System
This toolkit gives you the actual formulas lenders use, the worksheets to model your own scenarios, and the decision frameworks that free tools deliberately leave out — because their business model depends on sending you to a mortgage broker, not on giving you accurate math.
It covers every major English-speaking mortgage market: the US, Canada, the UK, Australia, and New Zealand. This matters because mortgage mechanics differ in ways that break generic calculators. Canadian mortgages compound semi-annually, not monthly. Australian loans calculate interest daily against an offset account balance. UK products revert to a punitive variable rate after the fixed period ends. The toolkit handles all of this with jurisdiction-specific formulas and worked examples.
What's Inside
Full PITI Calculator — Because Principal and Interest Is Only Half the Story
Every cost component that actually hits your bank account each month: principal, interest, property taxes, homeowner's insurance, mortgage insurance (PMI/CMHC/LMI), HOA fees, and a maintenance reserve. Most calculators show you $1,796. The real number on the same property is $2,609. The PITI worksheet shows you why, line by line.
Affordability Reverse-Engineering — Start from Your Budget, Not the Bank's Ceiling
Instead of asking "can I afford this house?", start with your actual take-home pay and lifestyle expenses and work backward to a maximum purchase price. The worksheet uses the 28/36 DTI framework but applies it to your real take-home pay, not the gross income figure lenders use to inflate your borrowing power.
Side-by-Side Scenario Comparison — Because Every Decision Changes Everything Else
Compare 15-year vs. 30-year terms. Model 5% down vs. 10% vs. 20% and see exactly how PMI, total interest, and monthly cash flow change across each scenario. Test the impact of a 0.5% rate difference — which typically shifts total interest by $35,000 to $40,000 on a standard loan. Free tools let you test one scenario at a time and force you to overwrite your inputs. This toolkit shows them all at once.
Rent vs. Buy Decision Framework — The 5% Rule, Not Guesswork
The "renting is throwing money away" line is marketing, not math. The toolkit uses the 5% Rule: multiply the purchase price by 5%, divide by 12, and compare that to your current rent. That number captures the annual unrecoverable costs of ownership — property tax, maintenance, and the opportunity cost of your equity. If your rent is lower, renting is mathematically cheaper. The worksheet does this calculation with your actual numbers.
PMI Cancellation Timeline — Know Exactly When the Penalty Ends
If your down payment is below 20%, you pay mortgage insurance that protects the lender, not you. The toolkit calculates your exact monthly PMI cost and shows the precise month when your loan-to-value ratio hits 80% (when you can request removal) and 78% (when it cancels automatically). It also shows how extra principal payments accelerate that timeline.
Extra Payment & Biweekly Payoff Modeler — Shave Years Off Your Mortgage
One extra payment per year — just your regular payment divided by 12, added monthly — typically eliminates 4 to 5 years from a 30-year mortgage and saves tens of thousands in interest. The amortization override worksheet lets you model irregular extra payments (a year-end bonus, a tax refund) and see the compound impact on your entire payoff timeline.
Discount Points Break-Even Calculator — Know If Buying Down Your Rate Is Worth It
Lenders offer to reduce your rate in exchange for an upfront fee (one point = 1% of the loan). The toolkit calculates the exact break-even month. If you plan to move or refinance before that month, you lose money on points. If you plan to stay longer, you save. It is a straightforward division problem, but the stakes are thousands of dollars and no free tool frames it clearly.
Refinancing Break-Even Worksheet — Do Not Chase a Lower Payment That Costs More
A refinance that lowers your monthly payment by $200 but restarts a 30-year clock can add tens of thousands in total interest. The refinancing worksheet calculates the true break-even month after accounting for closing costs and the amortization reset. It compares total remaining cost on both paths — not just the monthly number — so you see whether the refinance actually saves money or just moves it around.
Rate Stress Test — Know If Your Budget Survives a Shock
Variable-rate borrowers, Canadian buyers facing renewal, and UK homeowners approaching SVR reversion all face the same question: what happens if rates jump? The stress test worksheet recalculates your payment at +1%, +2%, and +3% above your contracted rate and shows what percentage of your take-home pay goes to housing at each level. It includes the official stress test thresholds for Canada (OSFI qualifying rate), Australia (APRA 3% buffer), and UK lender affordability assessments.
Country-Specific Adjustments — Because Mortgage Math Is Not Universal
Semi-annual compounding for Canadian mortgages. Daily interest calculation against offset account balances for Australian and New Zealand loans. Product fees and SVR reversion modeling for UK buyers. Low Equity Premium and Low Equity Margin calculations for New Zealand. CMHC insurance premium bands for Canada. The formulas are different in each country, and using the wrong one gives you the wrong answer.
Who This Toolkit Is For
- Pre-approval stage buyers who received a number from the bank and need to stress-test it against their actual lifestyle budget before making an offer.
- Active property searchers who are comparing specific homes and need exact, localized cost calculations — not the generic averages that portal calculators default to.
- Renters deciding whether to buy who need a mathematical framework instead of societal pressure to make the largest financial decision of their life.
- Homeowners evaluating refinancing or accelerated payoff who need break-even analysis, not a lender's sales pitch.
Why Not Just Use a Free Calculator?
Free calculators exist to generate mortgage leads. Zillow's calculator defaults to assumptions that minimize your displayed monthly payment — because a lower number makes you more likely to contact an agent. Bankrate and NerdWallet display "teaser" rates tied to perfect credit scores and 20% down payments, then funnel you to affiliate broker links. Dave Ramsey's calculators are ideologically locked to 15-year mortgages and funnel you to Churchill Mortgage.
None of them let you compare scenarios side by side. None model the opportunity cost of a larger down payment versus investing the difference. None adjust for Canadian compounding, Australian offset accounts, or UK product fees. None work offline. And none stop selling to you long enough to give you accurate math.
This toolkit has no affiliates, no lead forms, and no teaser rates. It is a set of formulas, worksheets, and worked examples designed to give you the right answer — not a comfortable one.
Satisfaction Guarantee
If the toolkit does not help you understand your true mortgage costs, email us and we will refund your purchase. No time limit, no questions.
— Less Than a Single Hour with a Mortgage Broker
A mortgage broker charges hundreds of dollars per hour and still works on commission from the lender. This toolkit gives you the same calculations — without the conflicts of interest.
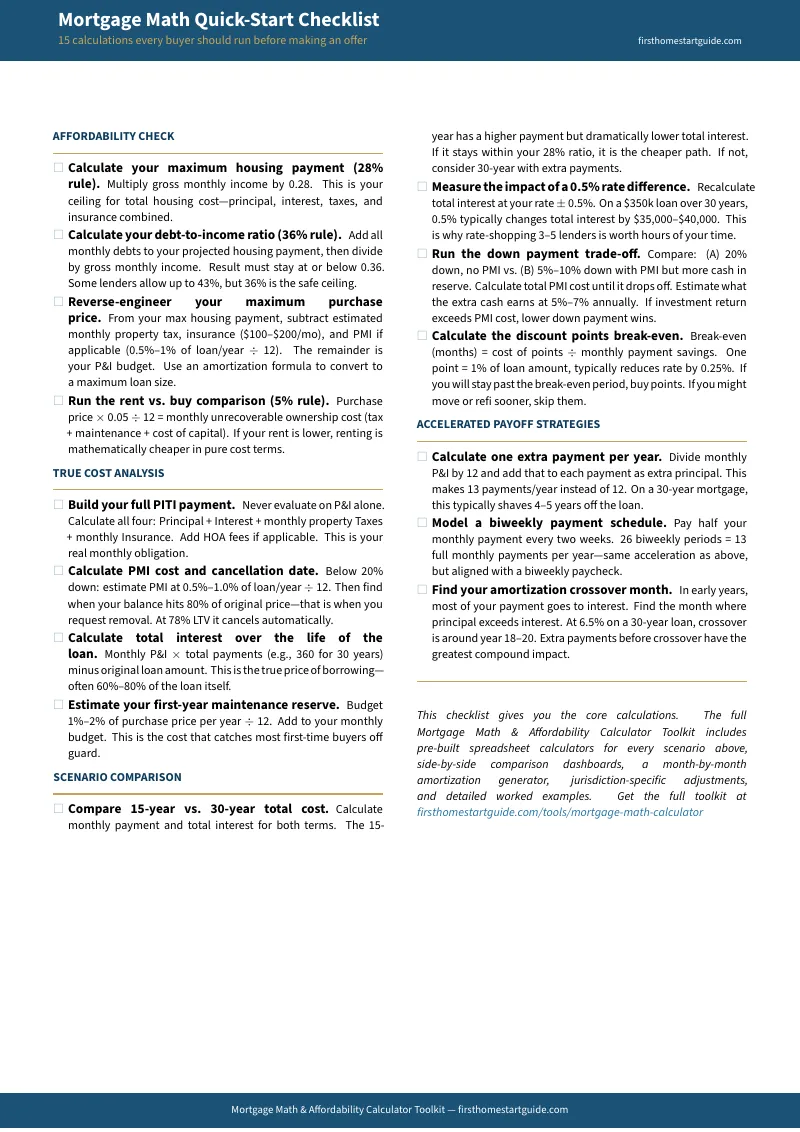
Download the free Quick-Start Checklist to run your first 15 calculations tonight. When you need the full formula library, multi-scenario comparison worksheets, amortization engine, and country-specific adjustments, the complete toolkit is here.